 Download images
Explanation:
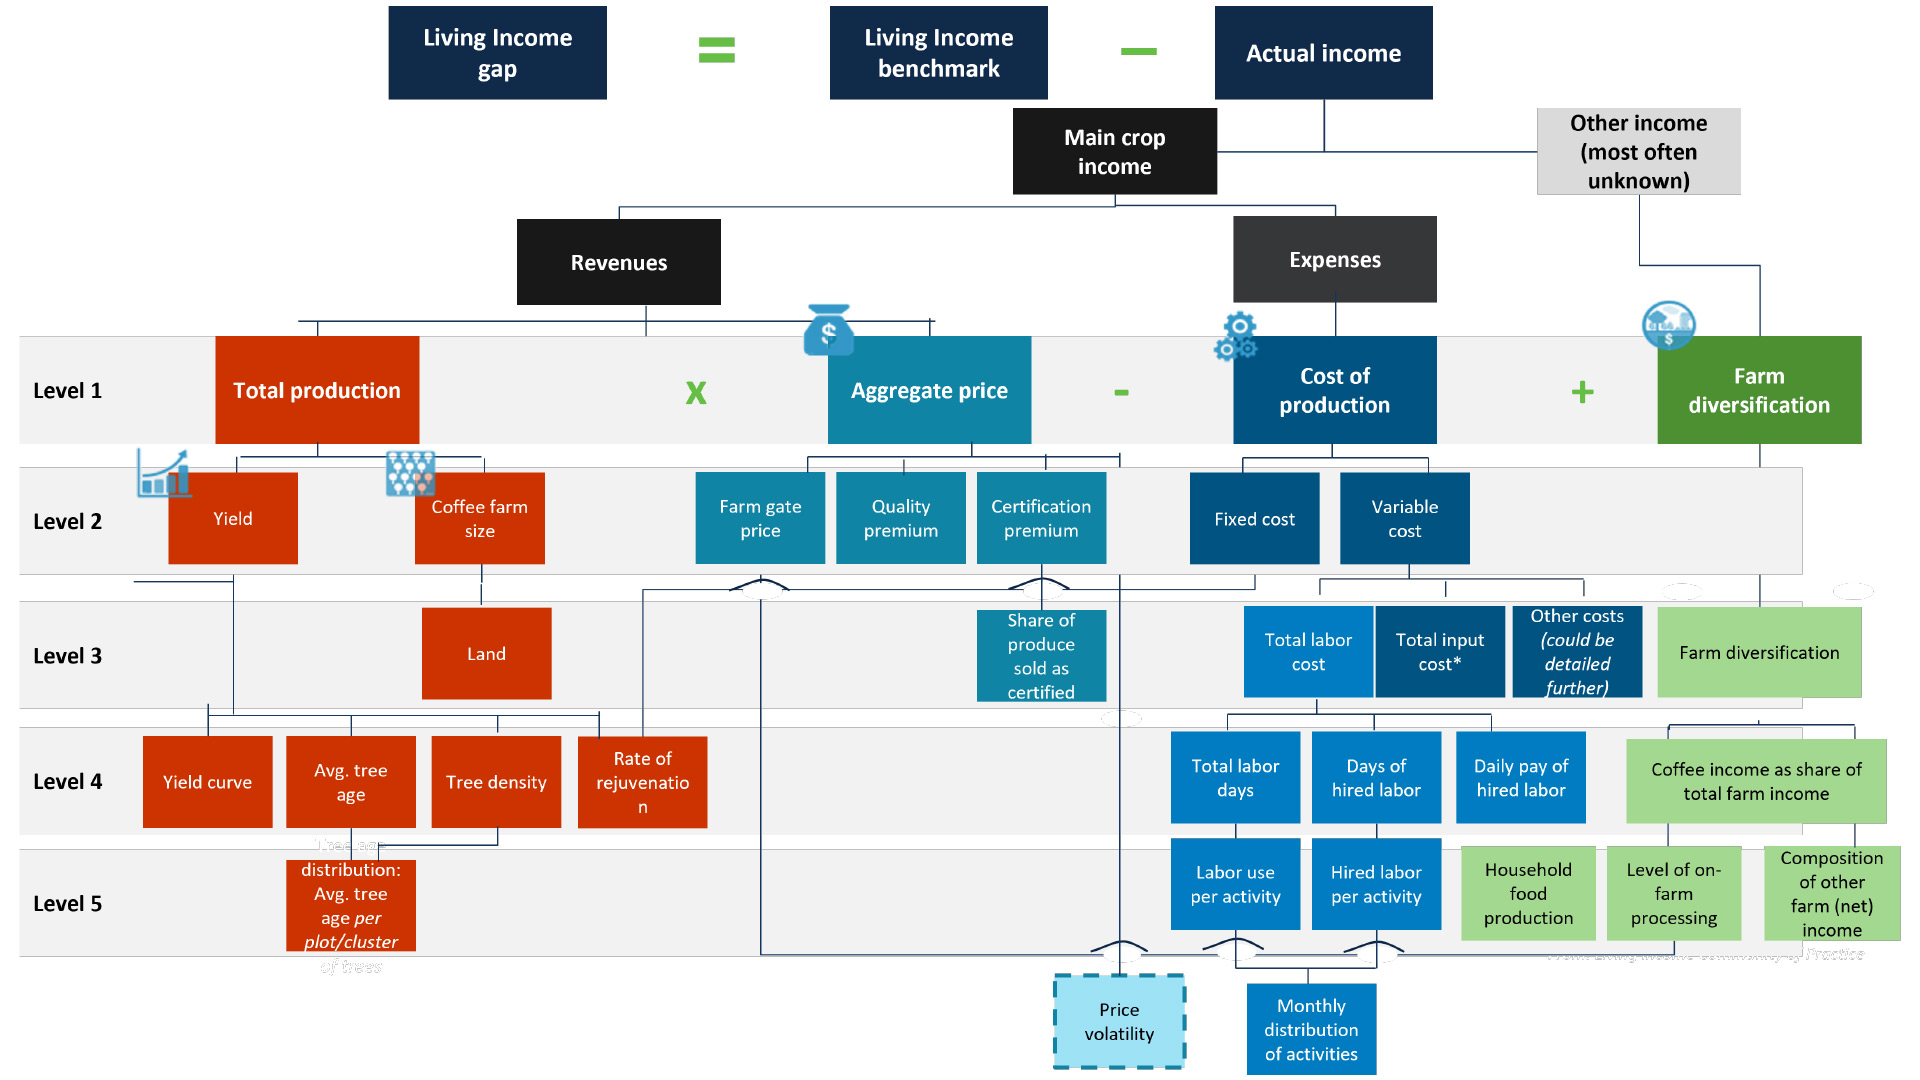
One can distinguish five ‘drivers’ to improve farmer income: Productive farm land, Yield, Price (farm-gate), cost of production, and diversification.
Determine the minimum, average, and feasible levels of each of these drivers.
The different components of the income drivers are represented in this diagram:
Developed by: NewForesight (2021)
See also:
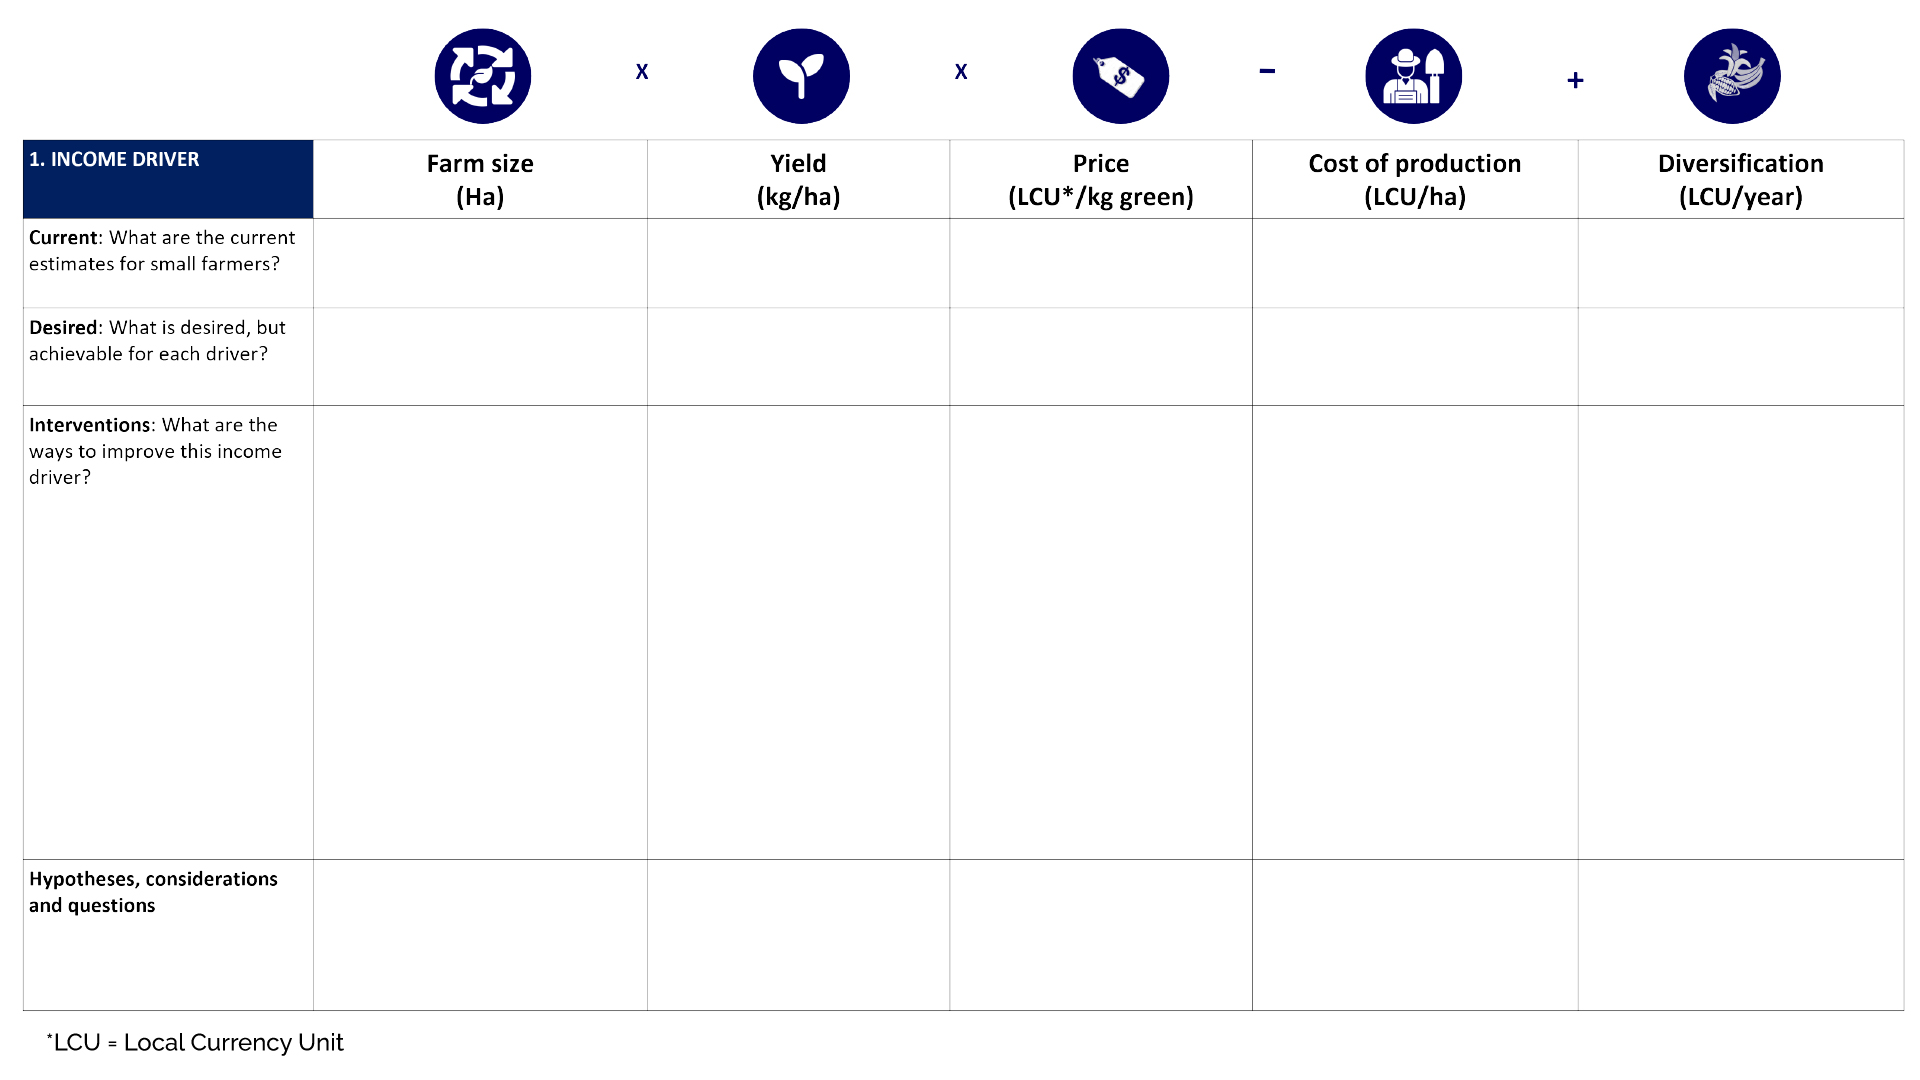
The following template can be used to guide this sub-step.
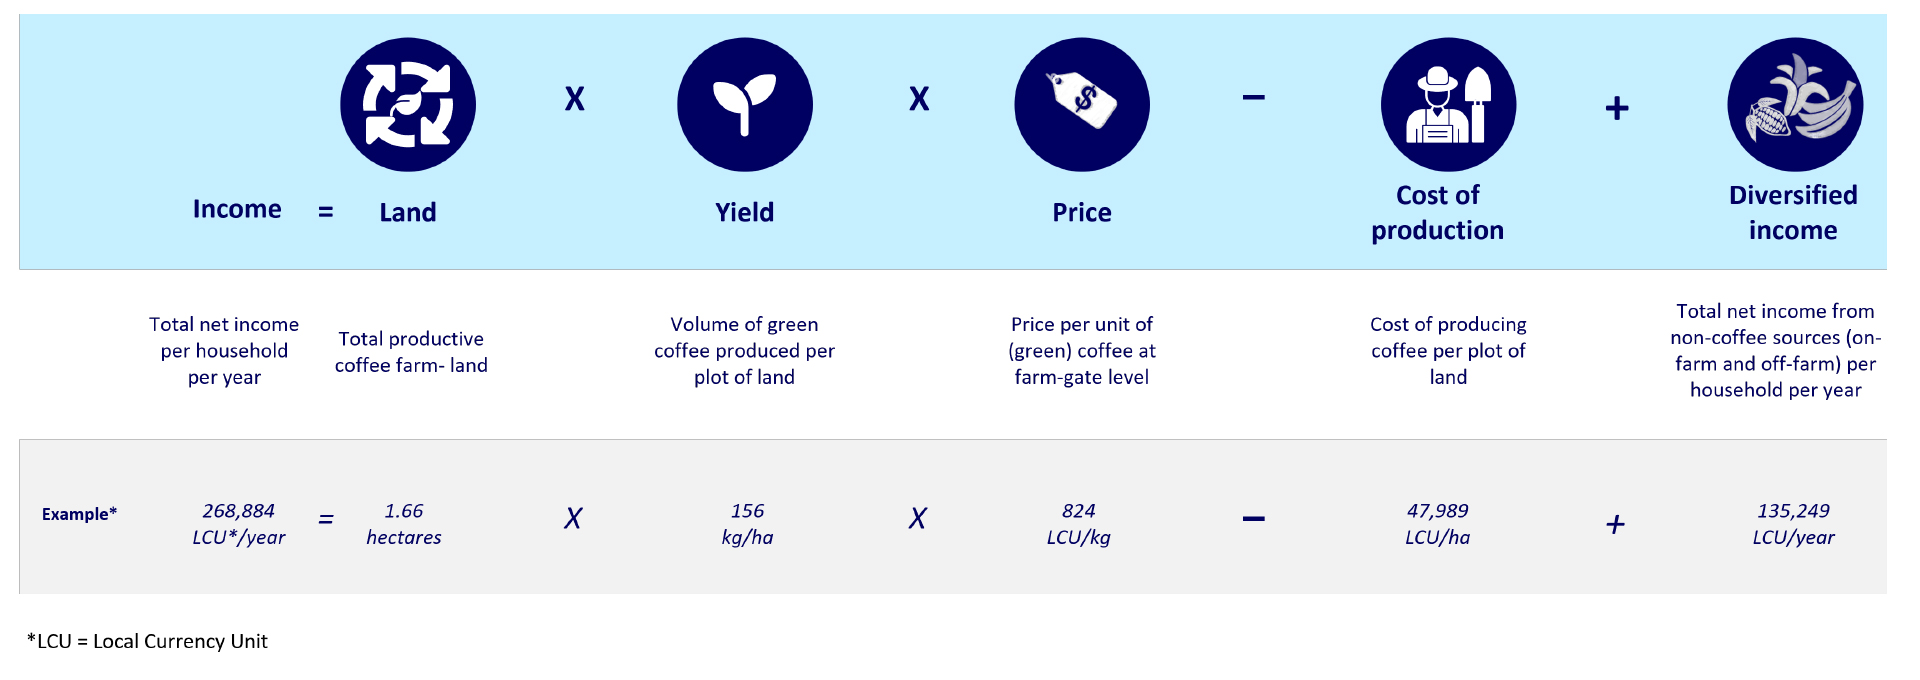
You can find below an indicative example from the application of this sub-step:
Explanation:
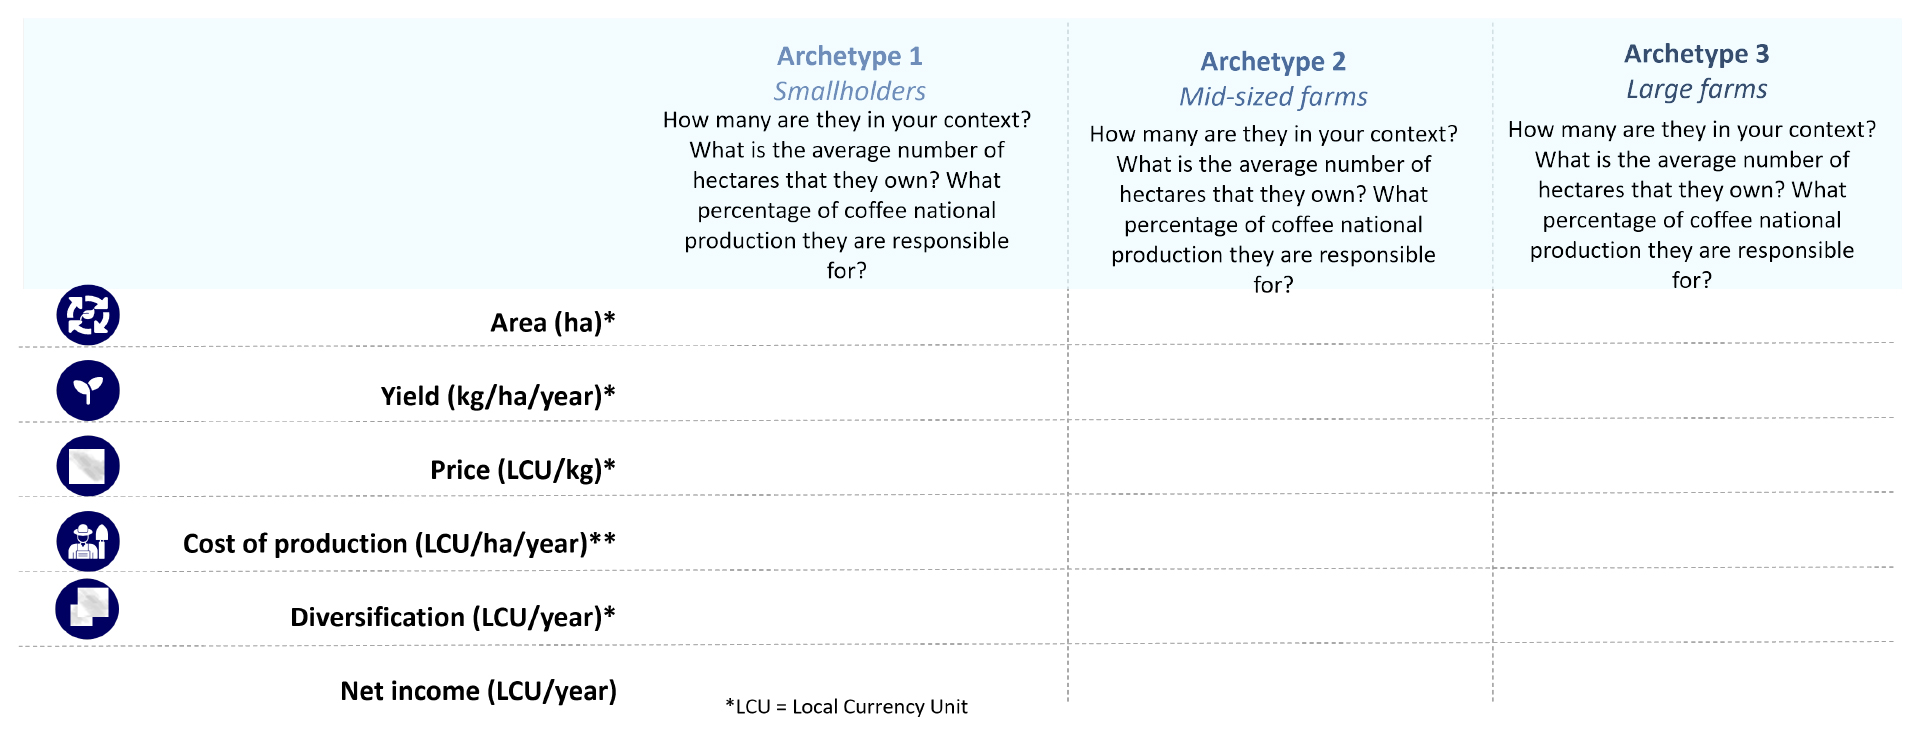
Determine ‘who’ you are going to target with the strategy. What segments or archetypes of farmers exist in your origin?
Determine the key parameters according to which you create an archetype: e.g., farm size, yield levels, or climatic conditions.
The following indicative templates can be used to guide this sub-step.

An indicative example from the application of this sub-step is reported here:
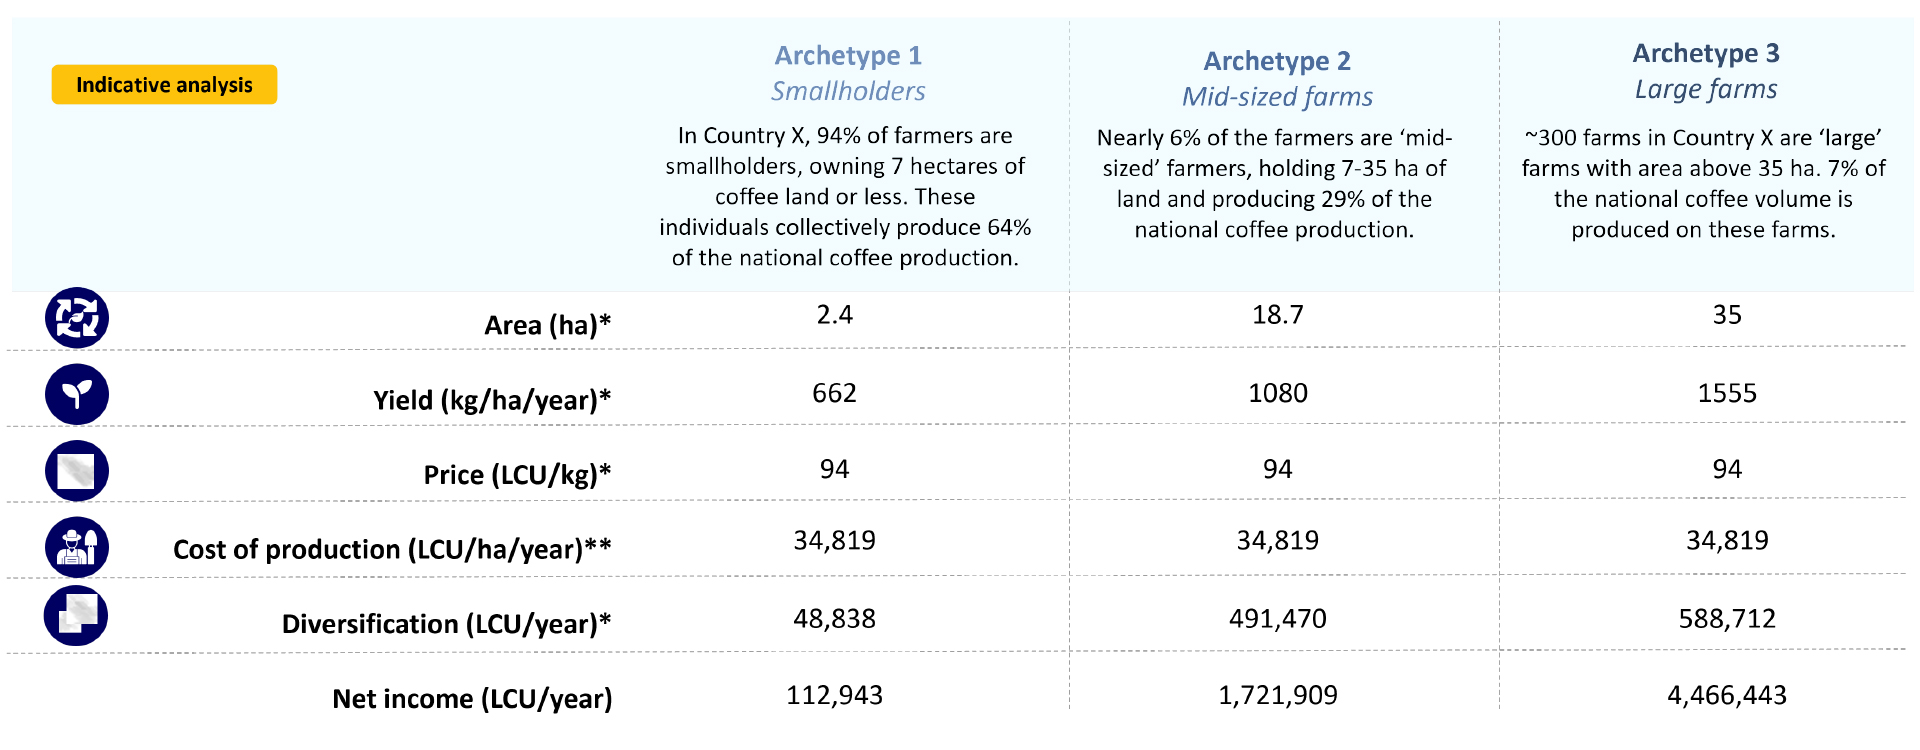
Explanation:
Determine the average incomes for farmers in each archetype.
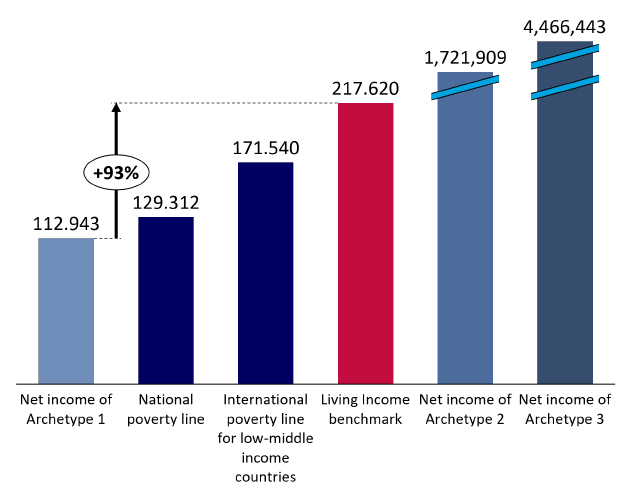
Select the right ‘benchmarks’ to measure current incomes against – choose the benchmarks that are most meaningful to (external) stakeholders, e.g., a national reference, World Bank Poverty Line or Living Income Benchmark.
As an example, you can find below the results of calculating the income gap using indicative data from Country X, based on different benchmarks and Archetypes (indicating that 94% of farmers earn below the poverty line and Living Income benchmark):
Living income gap of a coffee producer – for 3 archetypes under feasible conditions
In LCU*/year
Observations:
*LCU = Local Currency Unit
Explanation:
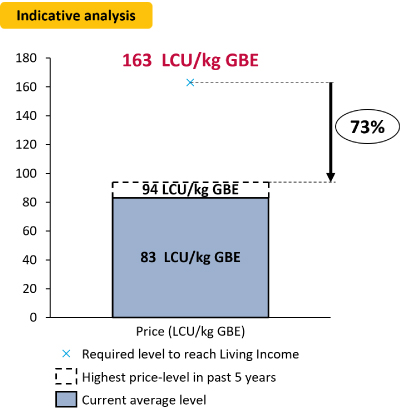
Calculate the effect of changing one variable or income ‘driver’ on incomes. Whilst this does not reflect reality, it is a modelling exercise to quantitatively show our bias towards a single variable (e.g. ‘increase price’).
Do this analysis for each driver.
Using the same case from the previous sub-steps, please see below the example of only changing one variable, demonstrating that it is often not sufficient to close income gaps.
Required farm-gate price of green coffee (GBE) to reach a Living Income – all other variables equal
Shown for Country X, in LCU*/kg
Observations:
Explanation:
Calculate the effect of changing two variables, ceteris paribus: keeping the other variables constant.
You can do this using a ‘sensitivity analysis’, displaying the two variables on the horizontal and vertical axis, and the product (e.g., the income) in the table.
Continuing with the example of the indicative data from previous sub-steps, it emerges that even changing two variables is insufficient to close the identified income gap:
Scenario analysis on the income generated by increasing yield (kg/ha) and productive coffee land (ha), everything else equal – at a farm-gate price of 83 LCU*/kg
Shown for Country X, variation on archetype 1
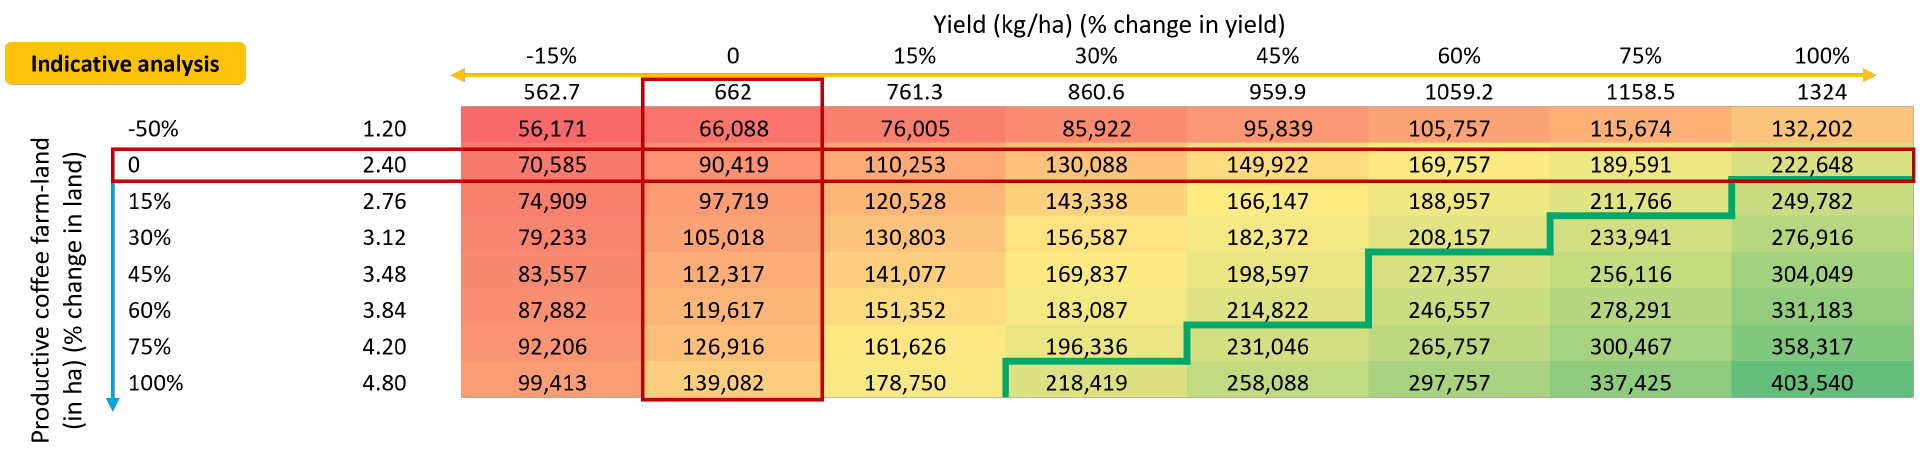
Explanation: The numbers in the colored boxes show the household income (including non-coffee income). The horizontal axis shows variation in yields, while the vertical axis represents variation in productive coffee farm-land. The red boxes highlight the current levels. The blue box indicates the income above the threshold of the Living Income.
Observations:
Other variables used for analysis
| Variable | Value |
| Farm-gate price | 83 LCU/kg |
| Cost of production | 34,819 LCU/ha |
| Other (net) income | 41,757 LCU/year |
*LCU = Local Currency Unit
Explanation:
Calculate the effect of a ‘smart mix’ of income drivers, by incorporating all five drivers.
You can do this using a ‘optimization analysis’: determine the ‘constraints’ per farmer archetype as to determine which variables should change by what rate to e.g. reach a living income.
Using the same case from the previous sub-steps, please see below the example of a ‘smart mix’ which includes all five income drivers to improve incomes and reach a living income over time”
The scenario analysis in the table shows how the prices, yield and farm size should change in a scenario where cost of production and diversification is maintained at current levels
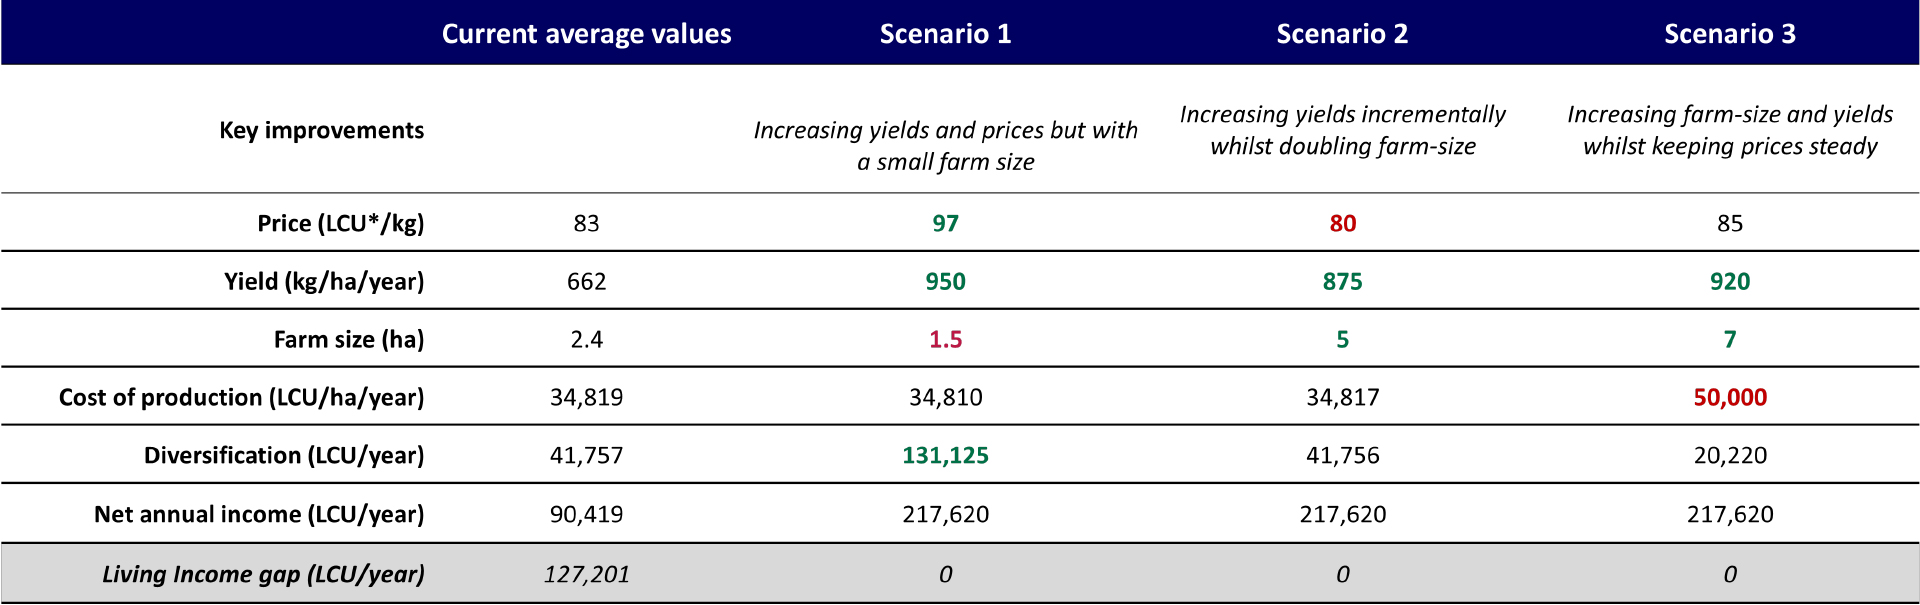
*LCU = Local Currency Unit
See also: IDH Income Driver Calculator to model scenarios to improve incomes
Explanation:
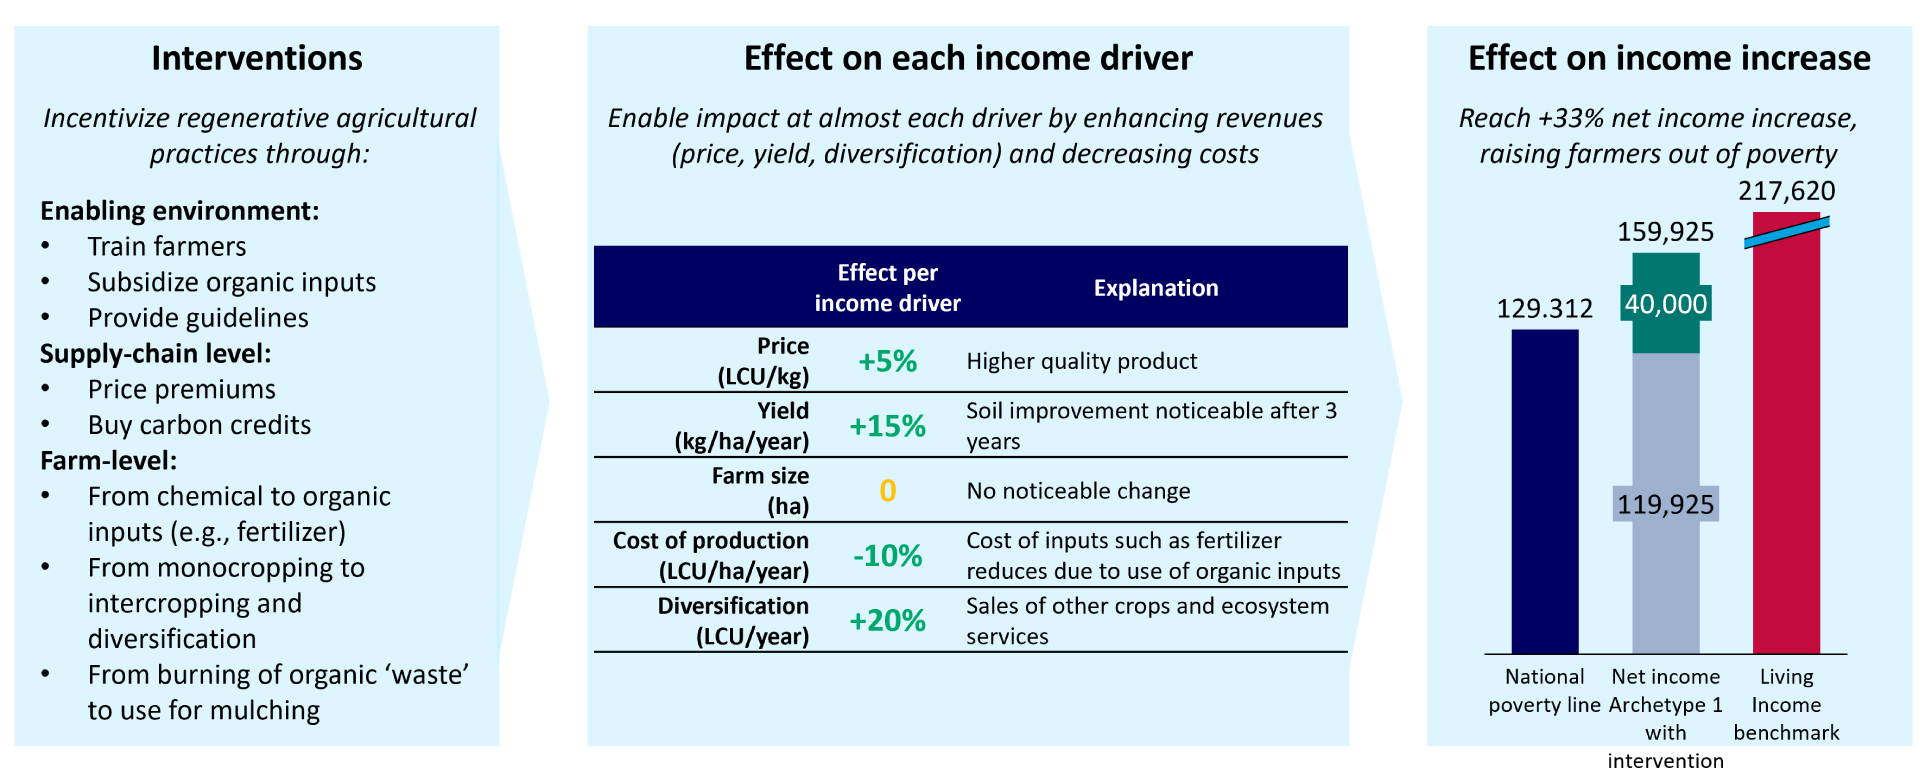
Determine which interventions at farm-level can be effective in reaching the required ‘smart mix’ of drivers. Then, the other steps of this Guide will help determine which stakeholders can help realize which interventions.
The following and indicative template can be used to discuss and identify solutions.
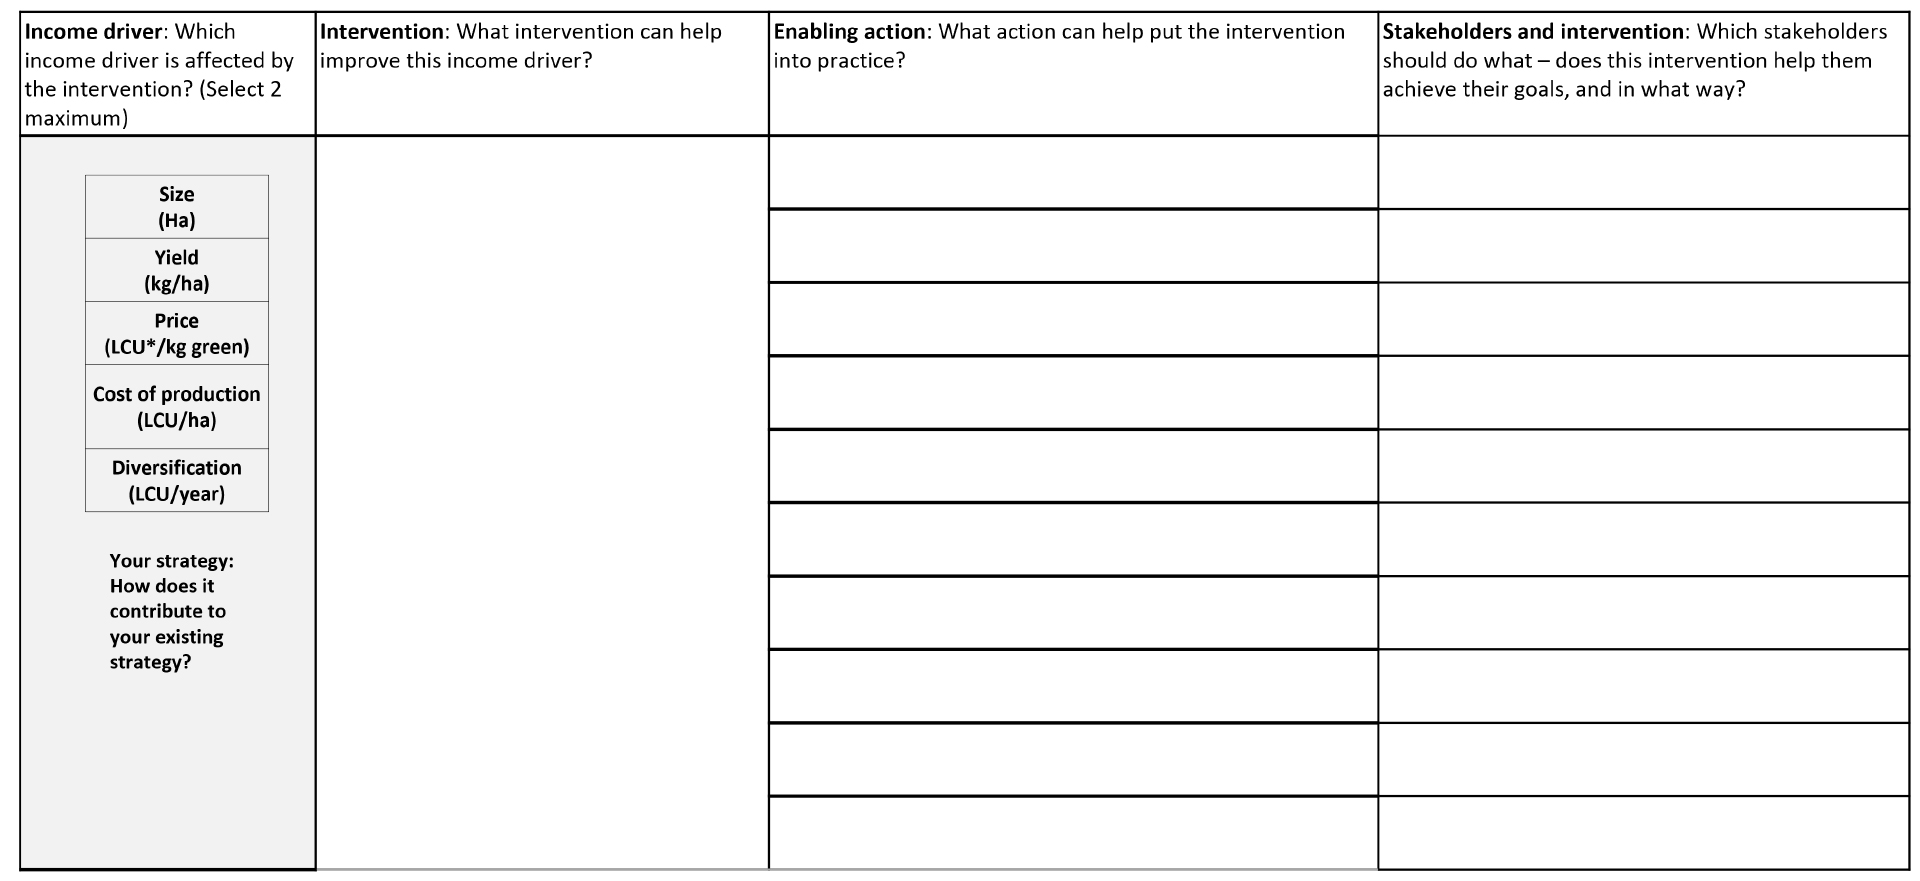
*LCU = Local Currency Unit
Here is an example of how different interventions can impact incomes (working at three different intervention levels: Enabling environment; Supply-chain level and Farm-level). In this example, interventions are made to incentivize regenerative agricultural practices: